NMS Setup
The initial set up of monitoring for Kentik NMS in the v4 portal is covered in the following topics:
Notes:
- For general information about setup tasks, see Setup Overview.
- For setup tasks related to onboarding cloud resources, see Cloud Setup.

About NMS Setup
Setting up NMS involves working through a wizard that gathers the information needed for Kentik to monitor metrics on devices and interfaces. The NMS Setup Wizard — on the NMS Setup page — is used in two contexts:
- Onboarding NMS: NMS setup is one setup task within the overall onboarding process that new Kentik customers (or trial users) go through to get up and running with Kentik (see Setup Overview). These tasks are listed at the left of the Welcome to Network Observability page.
- Updating NMS monitoring: Whenever you change the devices and interfaces in your network infrastructure you'll want to update your NMS discovery to be sure that all intended devices are being monitored. to do so, you'll access the NMS Setup page from the Discover Devices button on the NMS Devices page.
The wizard helps you deploy, on a machine in your own infrastructure, the Kentik NMS agent that collects metrics data and sends it to the Kentik SaaS. You can choose whether to deploy the agent via Docker or Linux. Once the collector is deployed, you tell it the IP ranges of the devices from which you wish to collect NMS data, then initiate the discovery process, which results in a list of devices that will be monitored by Kentik NMS.
SNMP Polling for NMS
For non-NMS applications involving SNMP, Kentik polls devices directly from the Kentik SaaS. In Kentik NMS, however, the monitored devices are polled by the machines on which you have deployed the Kentik NMS Agent with the NMS Setup Wizard.
By default, Kentik NMS will use the following SNMP polling intervals:
- 1 minute for device status, CPU, memory, and interfaces.
- 5 minutes for everything else.
Note: Polled devices can also be set for data collection via Streaming Telemetry; see NMS via Streaming Telemetry.
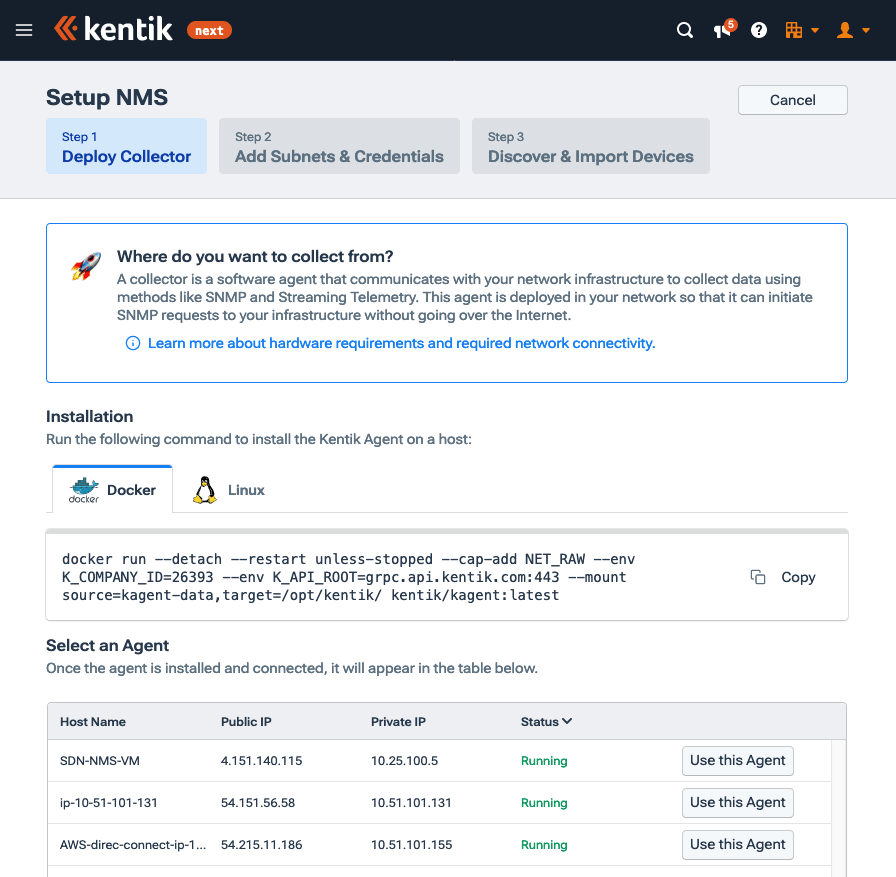
NMS Setup Wizard
Use of the NMS Setup wizard involves the following steps:
- Go to the NMS Setup page (see About NMS Setup).
- Choose whether to deploy the Kentik NMS agent via Docker or Linux, and click the corresponding tab.
- On the Deploy Collector page of the wizard, copy the command from the field at the top of the tab.
- If you'd like to use a web proxy you'll use the https_proxy environment variable to set the proxy's URL:
- Docker: Provide the environment variable as part of the docker run command:
--env https_proxy=http://address.of.your.proxy
- Linux: Set the environment variable before running the install command:
export https_proxy=http://address.of.your.proxy - Paste the command into terminal and run it.
- A new agent will show in the Select an Agent list. The value of the Host Name column will be:
- For Docker: The ID of the agent's Docker container.
- For Linux: The hostname of the Linux system where the agent was installed. - Click the Use this Agent button, which takes you to Step 2 of the wizard, Add Subnets & Credentials.
- In the IP Range field, enter a comma-separated list of the IP ranges of the devices that you’d like to monitor.
- From the Credential drop-down, choose an option for SNMP credentials for the device(s). To add a new credential, choose New Credential, which opens the New Credential dialog. Specify the following fields of the dialog:
- Type: The version of SNMP that you’ve already enabled on the device.
- Credential Name: Any user chosen name (no spaces).
- Community: The SNMP community that’s already configured on the device. - The Collection Agent drop-down will, by default, show the agent chosen in the Deploy Collector step. If desired, choose a different agent.
- Click the Start Discovery button at the bottom right, which takes you to Step 3 of the wizard, the Discover and Import Devices page.
- The agent will scan the IP Range, looking for devices that have the credentials enabled (configured) and SNMP enabled. Progress is shown in the indicators of the information pane across the top. As devices are discovered they are added to the Discovered Devices list below.
- In the list of discovered devices:
- Click the customize button to choose which columns of information are shown in the list.
- Uncheck the checkbox at the start of the row for any device that that you do not want to monitor. - Click the Add Devices button at the upper right. Monitoring will start for the checked devices in the list, and you’ll be taken to the NMS Devices page.
NMS Discovery
The Kentik portal's pages devoted to NMS discovery are covered in the following topics:
About NMS Discovery
Depending on the scope of your network infrastructure, device discovery may not be instantaneous when you run the NMS Setup Wizard. While discovery is ongoing, a temporary status indicator will appear in the portal's main navbar.
 The indicator includes the following UI elements:
- Discovery Count: The number of discoveries in progress.
- View All: A link to the Discovery Overview Page, where you can see a list of all in-progress discoveries in your organization.
Discovery Overview Page
The Discovery Overview page provides a way to check the status of all ongoing NMS discoveries initiated from the NMS Setup Wizard. The page is a list of cards, each providing information about one discovery.
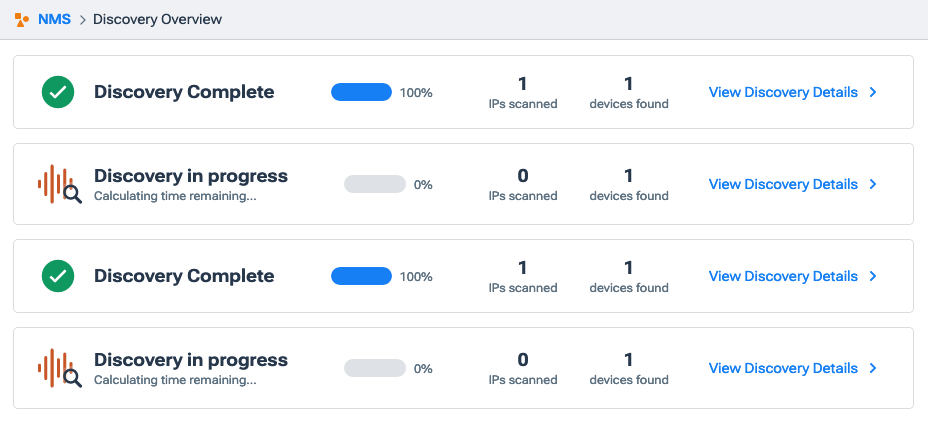
Each card includes the following UI elements:
- Discovery status: The status of the discovery:
- Complete: All IPs specified in the NMS Setup Wizard have been scanned.
- In progress: The scan of IPs has not completed. An estimate is provided of the time remaining. - Completion percentage: The percent of the IPs that have been scanned.
- IPs scanned: The number of IPs scanned.
- Devices found: The number of devices found.
- View Discovery Details: A link to the Discovery Details Page for this discovery.
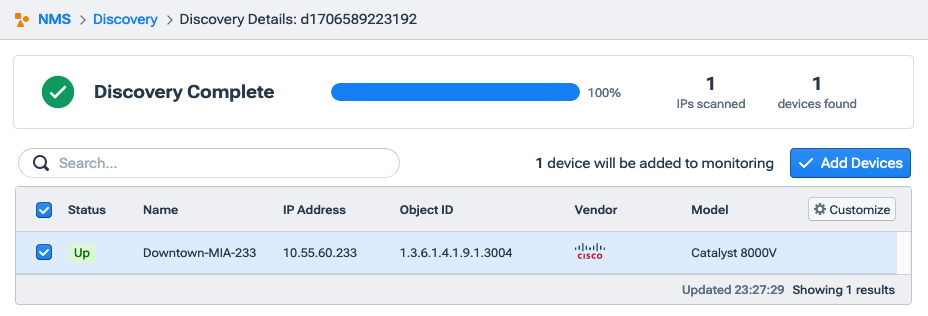
Discovery Details Page
The Discovery Details page provides details about one discovery in the list on the Discovery Overview Page. The page includes the following main UI elements:
- Information Pane: A set of indicators about the discovery (see NMS Discovery Indicators).
- Device list: A list of the devices discovered so far by this discovery (see NMS Discovery Device List).
NMS Discovery Indicators
The information pane across the top of an NMS Device Details page includes the same indicators that are found in each discovery card on the Discovery Overview Page.
NMS Discovery Device List
The device list for an NMS discovery is a table listing all of the devices found so far in the discovery. The list includes the following UI elements:
- Search: A field that filters the list to devices in which one of the table columns contains a match for the entered text.
- Monitored device count: A count of the number of devices in the list whose checkboxes are checked.
- Add Devices: A button that initiates NMS monitoring on any device in the list whose checkbox (at left of row) is checked.
- Select all: A checkbox in the table's heading row that toggles on or off the checkboxes of all individual device rows.
- Select device: A checkbox at the start of each row that selects the device for monitoring.
- Customize: A popup from which you can choose, using checkboxes, the columns that will be shown in the list (see Customize Columns).
- Columns: Information about the device in a given row of the list.
Note: By default, the Select device checkmarks for all found devices are on.
Customize Columns
The Customize Columns popup for the device list on an NMS Discovery details page includes the following columns that can be shown in the list:
- Status
- Name
- IP Address
- Object ID
- Vendor
- Model
- Device ID
NMS via Streaming Telemetry
Kentik NMS support for streaming telemetry is covered in the topics below:
- About ST for NMS
- Kentik ST Support
- ST Device Configuration
- ST Configuration in Kentik
- Viewing ST NMS Results
Notes:
- The topics below cover Kentik’s Streaming Telemetry implementation for NMS. Kentik also has limited support for collection via ST of data for records in the Kentik Data Engine, which is covered in SNMP and ST KDE Support.
- For information about differences between SNMP and Streaming Telemetry, see SNMP vs. Streaming Telemetry.
About ST for NMS
Using Streaming Telemetry for NMS has both benefits and limitations. starting with the benefits, ST has the following primary advantages over SNMP for NMS:
- Efficiency: ST's subscription model is much more efficient than SNMP polling for both the collector and the network infrastructure. This means you need fewer collectors in large environments and you’re less likely to cause high CPU usage on your network infrastructure.
- Granularity: While SNMP polling intervals are typically 5 minutes and occasionally one minute, the data collection interval for ST data is one minute and sometimes as often as one second or even sub-second.
- Accuracy: In ST, data is timestamped by the monitored device, eliminating the false spikes or troughs that can occur in SNMP due to variations in transit time to the collector.
- Data Availability: Some vendors (e.g. Juniper) are now making new data types available only via ST.
Despite the above, ST also has some potential drawbacks:
- Vendor support: As of this writing, most network gear does not support Streaming Telemetry. Even when vendors support it there is greater variation in the way that data is made available.
- Data scope: Some of the data needed by Kentik NMS is not available via ST. Regarding interfaces, for example, you need SNMP to map a device’s components before you can use ST to collect data about them. As a result, Kentik NMS typically can't be used on devices that support ST but not SNMP.
- Protocol support: Kentik's initial iteration of ST for NMS does not support all variations of ST in current use; see Kentik ST Support.
With the above pros and cons in mind, Kentik is committed to supporting ST as a first class citizen like SNMP. Designed to transparently mix ST and SNMP monitoring, Kentik NMS enables you to take full advantage of ST whenever your network infrastructure makes that possible, while still making it easy to use SNMP when ST isn't feasible.
Note: For assistance with any obstacles to your adoption of ST, contact Customer Support.
Kentik ST Support
Kentik NMS currently supports the ST-related options shown in the table below.
| Supported | Not currently supported | |
| Transport | gRPC (Google Remote Procedure Call) | - TCP - UDP |
| Session Initiation | Dial-in via gNMI protocol (gRPC Network Management Interface): The collector initiates the connect to the device. | Dial-out: The device initiates the connection to the collector. |
| Encoding | JSON | - XML - Google Protocol Buffers (GPB) |
| Modeling | - OpenConfig - Vendor-proprietary |
Non-gNMI models |
ST Device Configuration
Unlike SNMP support, vendor support for streaming telemetry in devices (routers, switches, firewalls) is still a work in progress. Kentik support for ST — which will continue to evolve as vendor support matures — is documented by way of the following examples that you'll find in our configuration repo:
- gNMI Dial-in Configuration for Juniper Junos: https://github.com/kentik/config-snippets/blob/master/Juniper/MX-series/telemetry_dialin.conf
- gNMI Dial-in Configuration for Cisco IOS-XR: https://github.com/kentik/config-snippets/blob/master/Cisco/IOS-XR/telemetry_dialin.conf
- gNMI Dial-in Configuration for Arista EOS : https://github.com/kentik/config-snippets/blob/master/Arista/telemetry_dialin.conf
Note: Check with your device vendor for the latest configuration syntax and support.
ST Configuration in Kentik
Streaming Telemetry can be used for NMS on a given device under the following conditions:
- The device itself is configured to publish Streaming Telemetry data.
- The device is already discovered for monitoring by Kentik NMS (see NMS Setup Wizard).
Enabling streaming telemetry on a device for monitoring by Kentik NMS is a two-phase process:
- Use the NMS Setup Wizard to discover SNMP-enabled devices on your network and add them to monitoring.
- Set Streaming Telemetry on individual devices (see Adding Streaming Telemetry).
Adding Streaming Telemetry
Streaming Telemetry is enabled for a device on the Streaming Telemetry tab of the device's Device Settings dialog, where you'll check the Dial-in from Kentik Agent checkbox and fill in a set of fields (see Device ST Settings).
 SNMP polling for CPU, memory, and interface statistics on the devices will stop, and these values will instead be collected via Streaming Telemetry at the following intervals:
- Default collection interval: 30 seconds.
Note: This interval is configurable using Custom Device Profiles., which can also be used to collect additional custom metrics. - CPU interval: Every 2 seconds. Live updates can be seen on the NMS Devices page.
Note: Even with ST enabled, SNMP polling will continue for information such as hardware monitoring, BGP monitoring, and hardware information (e.g. make and model).
Viewing ST NMS Results
Once ST is enabled on supported NMS-monitored devices the ST-collected data will be presented in portal pages such as NMS Dashboard, Metrics Explorer, and NMS_Devices. To enable seamless integration of data from all sources, ST and SNMP data is normalized into the same schema, so it's not obvious which collection method was used for what. You can, however, see if ST is in use for a given device by checking whether the Dial-In from Kentik Agent checkbox is checked on the Streaming Telemetry tab of the device's Settings dialog (see Device ST Settings).