Library
The Library module is covered in the following topics:
- About the Library
- Adding Library Items
- Library Page
- Library Bookmarks
- Library List
- Library Action Menu
- Filters Pane
- Kentik Presets
- Library Keyboard Shortcuts

About the Library
The Library in the Kentik portal provides a single place to find, view, and manage (create, edit, label, etc.) views of your organization’s network traffic data. The following kinds of views are available in the Library:
- Dashboard: A page with one or more panels that each display a single view of traffic data (graph, table, or gauge); see About Dashboards.
- Saved view: A page with a single view based on a collection of settings saved in Data Explorer; see About Saved Views. The underlying query settings can’t be adjusted from the view presented in the Library, but you can load a saved view into Data Explorer for access to the full control set.
The Library does not replace modules such as Data Explorer or Metrics Explorer as a tool for deep ad hoc analytics on network traffic, but rather makes it easier for you to find your most-used visualizations. The provided controls enable you to quickly adjust key parameters without digging deeply into all aspects of the settings behind each view.
Note: Both dashboards and saved views may be either user-created or Kentik-provided (see Kentik Presets).
Adding Library Items
Dashboards and saved views are automatically added to the Library upon creation:
- Dashboards: Creating a dashboard involves adding a new dashboard to your organization's collection of dashboards, after which you would typically add and configure at least one panel for that dashboard. To add a new dashboard, see Add a Dashboard.
- Saved Views: A new view can be created and saved in the Library or in Data Explorer; for details see Create a View.
Library Page
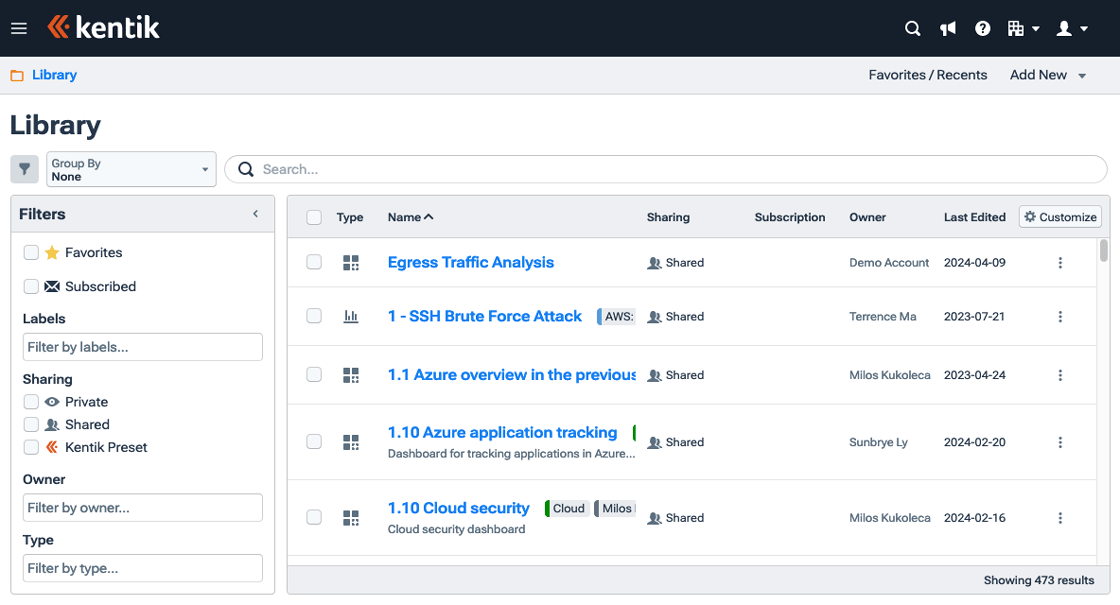
The Library page, reached by choosing Library from the main navbar menu, enables users to create, access, and modify the dashboards and saved views in their organization. The Library page includes the following main UI elements:
- Favorites/Recents (on SubNav): A button that expands/collapses the Bookmarks pane.
- The toggle can also be activated using the hotkey "shift + f” (see Library Keyboard Shortcuts).
- User preference for the display of the Library bookmarks is retained. - Add New (on SubNav): A drop-down from which you can choose the following actions:
- Dashboard: Opens the Add Dashboard dialog (see Dashboard Dialogs).
- Saved View: Opens the Add Saved View dialog (see Saved View Dialogs UI). - Bookmarks: A pane at the top of the Library page that expands/collapses from the Favorites/Recents button. The pane includes two tabs for bookmarks of dashboards/saved views: Favorites and Recents (see Library Bookmarks).
- Library list: The main display area of the Library page shows a table that lists your organization's dashboards and saved views (see Library List).
Library Bookmarks
The expandable/collapsible Bookmarks pane at the top of the Library page is covered in the following topics:
Bookmarks Tabs
The Bookmarks pane contains two tabs that each display a row of cards for dashboards and saved views:
- Favorites: A tab populated with cards for dashboards/saved views marked as Favorites by you or others within your organization (see Favorites Tab).
- Recents: The cards shown on this tab contains dashboards/saved views that you have most recently visited (see Recents Tab).

Favorites Tab
The Favorites tab includes a bookmark for every dashboard/saved view that you have designated as a favorite using the Add to Favorites (star icon) action. Each card in the Favorites tab contains the following UI elements:
- Favorite (star icon): An icon indicating whether the item has been designated a favorite.
- Name: The name of the dashboard/saved view.
- Action Menu: A vertical ellipses that opens a drop-down Library Action Menu.
- Owner: The owner of dashboard/saved view.
- Type: An icon indicating whether the item is a dashboard or a saved view.
Note: The action menu for a bookmark will be the same as for the row of the corresponding dashboard/saved view in the Library List.
Manage Favorites
To add or remove a bookmark from the Favorites tab, click the favorites icon (star) to remove the Favorite designation from the dashboard/saved view. The icon appears in the following locations:
- In the bookmark.
- In the row of the Library list for the dashboard/saved view corresponding to the bookmark.
- In the title bar on the page for the corresponding dashboard or saved view.
- In the Saved Views drawer on the Data Explorer page
Recents Tab
The Recents tab includes bookmarks for the dashboards/saved views that you have most recently visited (whether or not they are favorites). The UI for these bookmarks is the same as for the bookmarks on the Favorites Tab.
Library List
The Library list is covered in the following topics:
About the Library List
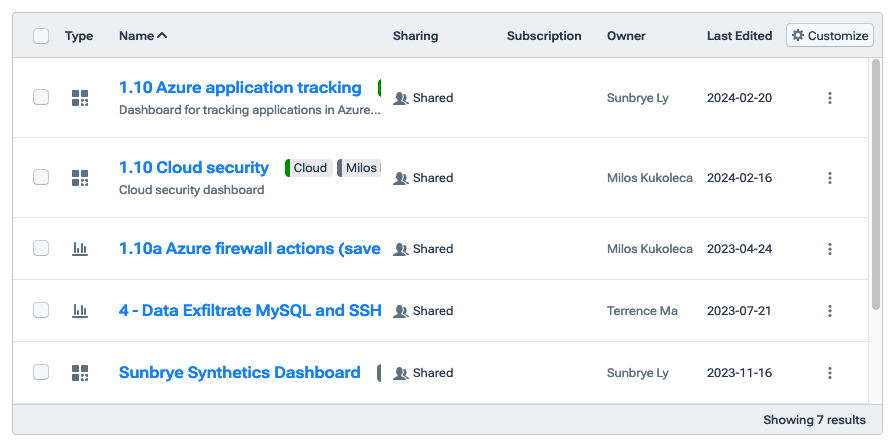
The Library list is a filterable table that displays all dashboards and saved views. Each row of the list represents one dashboard/saved view and shows information in its columns for that dashboard/saved view (see Library List Columns). To open the dashboard/saved view, click on its name in the row (see Dashboards or Saved Views).
You can change the sort order of the Library list by clicking on the heading of the column you’d like to sort by. Click the resulting blue up or down arrow to choose the direction (ascending or descending). In the bottom right corner, you can see how many items are currently listed in the table.
Library List UI
The Library list exists within a pane that includes the following list-related controls:
- Filter (filter icon): A button to toggle the display of the Filters pane.
- Group By: A drop-down to choose how to group the dashboards/saved views in the list (see Group By Options).
- Search: A field that shows lozenges for the currently set filters and also enables you to enter text. The Library list will be filtered to show only rows that match the filters and also contain the entered text in the Name column. To clear text from the field, click the X at the right. To clear a filter, click the X in the item’s lozenge.
- Filters pane: The Filters Pane to the left of the list contains filters that you can apply to narrow dashboards/saved views that appear in the list.
- Library list: A filterable table listing dashboards/saved views.
Group By Options
The Group By drop-down includes the following options:
- None: Dashboards/saved views are presented, without grouping, in the sort order determined by the currently selected column heading.
- Owner: Group the dashboards/saved views by their owner.
- Sharing: Group the dashboards/saved views by their visibility.
- View Type: Group the list by dashboards and saved views.
Library List Columns
The columns shown at any given moment in the Library list are set in the Customize Columns Popup. The following columns are available to be chosen from the dialog:
- Select: Checkboxes at the left of each row that select individual dashboards/saved views. To select multiple rows at once, use the Select All Checkbox.
Notes:
- Kentik Presets can't be selected.
- Selecting an item will display the Selected Item Controls above the list. - Type: An icon to indicate whether the item is a dashboard or a saved view.
- Name: The name of the dashboard/saved view along with additional details (see Name Column Information).
- Sharing: Indicates whether the dashboard/saved item is shared for viewing within the organization.
- Subscription: The number of subscribers and their Kentik user level (e.g. "1 Member").
- Owner: The owner of dashboard/saved view.
- Last Edited: The date on which the dashboard/saved view was last edited.
- Last Viewed: The date on which the dashboard/saved view was last edited.
- Action menu: A vertical ellipses that opens the drop-down Library Action Menu.
Select All Checkbox
The Select All checkbox in the heading row toggles the state of all checkboxes in the Select column:
- If either no checkboxes in the list itself are checked or only some are checked, then clicking this checkbox will select all listed dashboards/saved views, and will show the Selected Item Controls.
- If all checkboxes in the list are checked, clicking this checkbox will deselect all listed items and hide the controls.
Name Column Information
In addition to the name of the dashboard/saved view, the Name column of each row in the Library list includes the following items:
- Trending (flame icon): An indicator that the dashboard/saved view is trending (among the top 10 most-visited dashboards or saved views over the last month).
- Labels: The labels, if any, that have been applied to the dashboard/saved view.
- Description: The description, if any, of the dashboard/saved view.
- Guided Mode Controls (dashboards only): A set of controls enabling you to navigate from the Library list directly to a guided mode dashboard (see Guided Mode UI):
- Input: A drop-down menu or text field in which to provide the dashboard's guided mode value.
- Go: A button that takes you to the dashboard.
Customize Columns Popup
The Customize Columns popup enables you to choose the columns shown in the Library list. To customize the columns, click the Customize button at the top right of the list. The popup includes the following UI elements:
- Choose columns: Use the checkbox to the left of a column name to display that column in the Library list.
- Order columns: Use the handle to the left of a checkbox to click and drag that column into the desired order.
Once you’ve chosen the columns to include, click outside of the popup to close it. Your column selections will be saved for future visits to the Library page.
Selected Item Controls
The Selected Item Controls appear when one or more dashboards/saved views are selected in the Library list. These controls include the following:
- Add/Edit Labels: A link to the Labels Page, where you can create labels to apply to dashboards/saved views.
- Clear Labels: A button that removes all labels currently applied to any selected dashboards/saved views.
- Apply Labels: A field that shows all labels that are already applied to any selected dashboards/saved views.
- To remove an applied label, click the X in that label.
- To apply a label, click in the field to pop up a filterable list of labels, then click on any listed label to add it to the field and apply it to all selected devices.
- Multiple labels may be applied from the popup to the selected dashboards/saved views. - Remove View: A button that opens a confirmation popup that allows you to remove the selected dashboards/saved views from your organization.
- Rows selected: An indicator to the right of the controls showing the number of currently selected rows.
Library Action Menu
The Action menu for a dashboards and saved views in the Library list is covered in the following topics:
About the Action Menu
The Action menu for a dashboard/saved view opens from the vertical ellipsis at the right of the row for that dashboard/saved view in the Library list. The items on the menu vary depending on whether the row is for a dashboard or a saved view.
Common Action Menu Items
The following menu items are common to the Action menu for both dashboards and saved views:
 Export: Opens a submenu from which you can choose to export the dashboard/saved view as a PDF (see Portal Export Options).
- Subscribe: Opens the Subscription Dialog, which enables you to subscribe to the dashboard/saved view, either by choosing an existing subscription (combination of email address and schedule) or specifying a new one. A PDF of the current state of the dashboard/saved view will be emailed to the specified address at the scheduled interval.
- Unsubscribe (only if you're already subscribed): Opens the Unsubscribe dialog, which enables you to remove yourself from an existing subscription:
- Choose the subscription from the Subscription drop-down at top.
- Clicking the Unsubscribe button at bottom right. - Share: Opens the Share dialog, enabling you to share this dashboard/saved view with others (see Sharing via the Share Dialog).
- My Kentik Portal: Actions related to My Kentik Portal (only present if your organization has set up MKP):
- Preview as Tenant: Opens a submenu from which you can choose an MKP tenant, after which you'll be taken to the dashboard/saved view as it would appear to that tenant.
- Assign to Tenant: Adds this dashboard/saved view to the views available to a given tenant (see Tenant View Settings).
- Add to package: Adds this dashboard/saved view to an MKP package (see Package View Settings). - Remove: Opens a confirmation popup that enables you to remove the dashboard/saved view from your organization.
Dashboard Action Menu Items
The following Action menu options are available only for dashboards:
- Open in Edit Mode: Opens the dashboard in edit state (see Dashboard Edit Controls).
- Edit Properties: Opens the Edit Dashboard dialog (see Dashboard Dialogs).
- Clone Dashboard: Opens the Clone Dashboard dialog, which has the same fields and controls as the Edit Dashboard dialog but without the Dashboard Dependencies pane (see Dashboard Navigation). When property settings are complete for the clone click the Add Dashboard button to create the cloned dashboard.
Note: You can't edit dashboards that are Kentik Presets, but presets may be cloned and edits made to the resulting copy.
Saved View Action Menu Items
The following Action menu options are available only for saved views:
- Edit Properties: Opens the Edit Saved View dialog (see Saved View Dialogs).
- Clone Saved View: Opens the Clone Saved View dialog, which has the same fields and controls as the Edit Saved View dialog. When property settings are complete for the clone click the Add Saved View button to create the clone.
- Add to New Dashboard: Opens the Add Dashboard dialog (see Dashboard Dialogs), enabling you to create a new dashboard to which you can add this saved view as a panel.
Note: A dashboard panel created from a saved view is completely independent of that saved view, and modifications to one will have no effect on the other. - Add to Existing Dashboard: Opens the Add Data Explorer View Panel dialog, where you can specify the dashboard to which this saved view will be added as a panel.
Note: See note above.
Note: You can't edit the properties of saved views that are Kentik Presets, but presets may be cloned and edits made to the resulting copy.
Filters Pane
The Filters pane, which includes filters that narrow the items in the Library list, is covered in the following topics:
Filters Pane Controls
The Filters pane includes the following controls:
- Reset to default: An action link to clear all filters from the Library list.
- Collapse (collapse icon): A button to collapse and hide the Filters pane.
Note: To expand the pane again, use the Filter button (filter icon).
Filters Pane Filters
The Filters pane includes the following filters:
 Favorites: A checkbox that includes only dashboards/saved views that have been designated as favorites (see Manage Favorites).
- Subscribed: A checkbox that includes only dashboards/saved views that have been subscribed to.
- Trending: A checkbox that includes only dashboards/saved views that are trending (among the top 10 most-visited dashboards or saved views over the last month).
- Labels: A field that displays a lozenge for each selected label applied to a dashboard/saved view, and filters the Library list to dashboards/saved views with those labels (see Filters Drop-Downs).
- Select All: Include all labels found in the search.
Note: Within the drop-down, labels are organized with user-defined labels appearing first, followed by Kentik preset labels. - Sharing: Checkboxes that include only dashboards/saved views from a specified sharing setting.
- Private: Dashboards/saved views whose visibility is Private, meaning that you have made them for your own personal use and have not shared with others in your organization (no one else has access).
- Shared: Dashboards/saved views whose visibility is Shared, meaning that you or others in your organization have created them and designated them for use by everyone in the organization.
- Kentik Preset: Dashboards/saved views that have been created by Kentik (see Kentik Presets). - Owner: A field that displays a lozenge for each selected owner of a dashboard/saved view, and filters the Library list to dashboards/saved views with those owners (see Filters Drop-Downs).
- Type: A field that displays a lozenge for each selected type of a dashboard/saved view, and filters the Library list to dashboards/saved views of those types (see Filters Drop-Downs).
Filters Drop-Downs
Several fields in the Filters pane include a drop-down from which you can select an item to be applied as a filter:
- To select an item, click in the field and choose the item from the filterable drop-down list. A lozenge for the item will be added to the field.
- To remove an item, click the X at the right of that item's lozenge in the field.
Filter Application Rules
Kentik applies the following rules to filter categories and criteria:
- Filters are ORed within each of the categories (Favorites, Subscribed, Labels, Sharing, Owner, and Type), so dashboards/saved views matching any filter value within an individual category are considered a match for that category.
- Filters are ANDed between categories, so dashboards/saved views must match in all specified filter categories to be included in the Library list.
Kentik Presets
Kentik provides preset dashboards and saved views — referred to as "Kentik presets" — for all Kentik customers. Kentik has developed a wide variety of such presets addressing a range of use cases for various types of organizations (service providers, web enterprises, etc.). These presets have Labels with the Kentik logo to distinguish them from user created dashboards and saved views. Kentik presets are listed in the Library List when the Kentik Preset checkbox is selected in the Filters pane.
Library Keyboard Shortcuts
The Library page supports Portal Keyboard Shortcuts (hotkeys) to facilitate faster navigation without relying on mouse clicks. These shortcuts provide an efficient way to use features on the page. The table below shows the hotkeys for the Library page.
| Command | Keys |
| Show/Hide Hotkeys Modal | shift + ? |
| Show/Hide Favorites/Recents Bookmarks | shift + f |